








































Monitoring · for Managed Kubernetes and Deploio

See what your applications are doing.

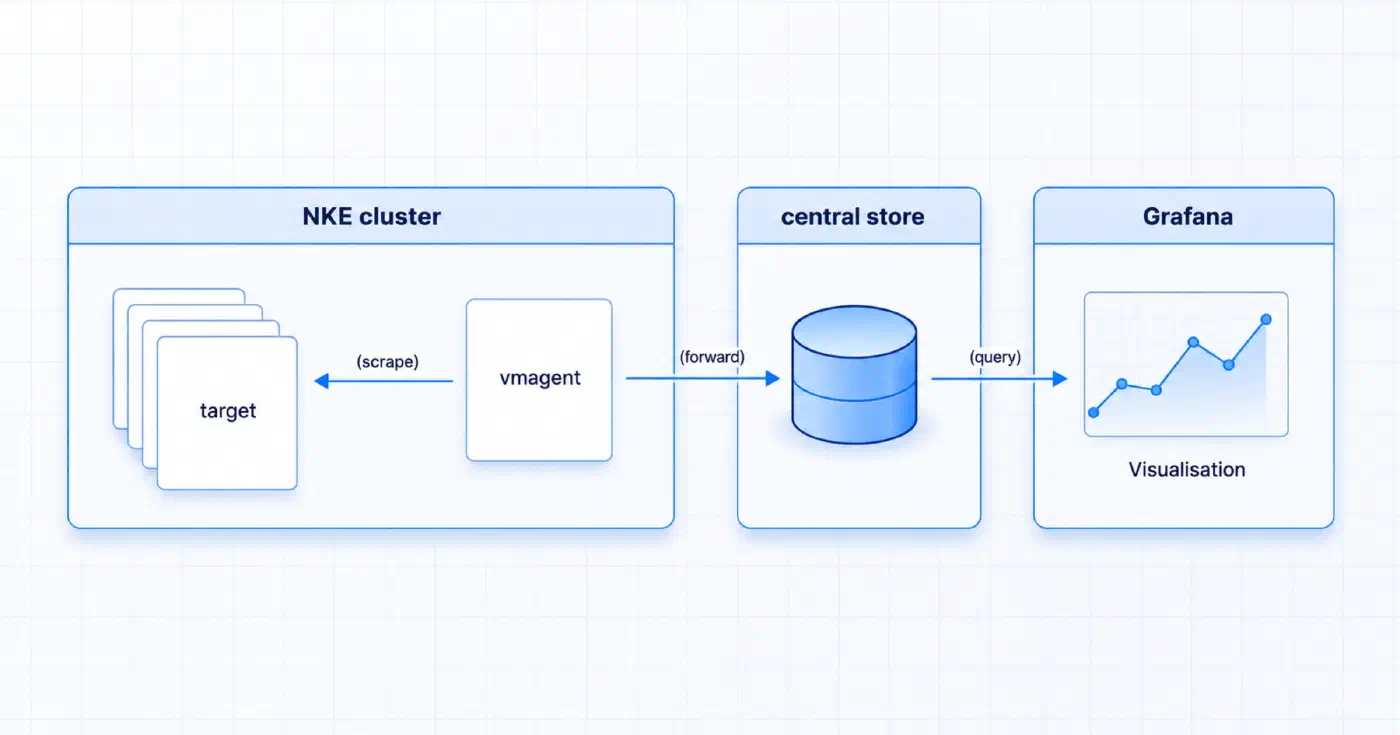
Metrics, dashboards and alerts for your Managed Kubernetes cluster, plus logs and traces if you need them. Metrics Agent, Grafana, Alertmanager, Loki and Tempo are optional services: you add them in Cockpit, we operate them. With Grafana, you also see your Deploio apps.

Metrics Agent from CHF 25.– per month Prometheus-compatible Added in Cockpit, operated by us Deploio dashboard in Grafana
Jump to
Use cases

Sound familiar?

“We need to see what our workloads are doing.”

How Monitoring helps

The Metrics Agent collects metrics from your workloads and cluster components via ServiceMonitors and PodMonitors. Grafana shows them in dashboards, starting with a default dashboard for your cluster.

“We want to know before our customers do.”

How Monitoring helps

Define alerting rules in PromQL. Alertmanager sends the notifications to Slack, email, PagerDuty or other channels, based on your configuration.

“When something breaks, we need logs and traces, not guesswork.”

How Monitoring helps

Collect logs with Loki and traces with Tempo, and explore them in the same Grafana instance.

“We run Prometheus on our cluster today.”

How Monitoring helps

Move to the Metrics Agent by giving it the same name as your Prometheus instance: your existing ServiceMonitors and PodMonitors keep working without relabeling.

“Each team should only see its own metrics.”

How Monitoring helps

Create a Grafana instance in a specific project, and it only shows the metrics of that project. In the default project, it shows all metrics of your organisation.

“We run our apps on Deploio and want more than the basic metrics.”

How Monitoring helps

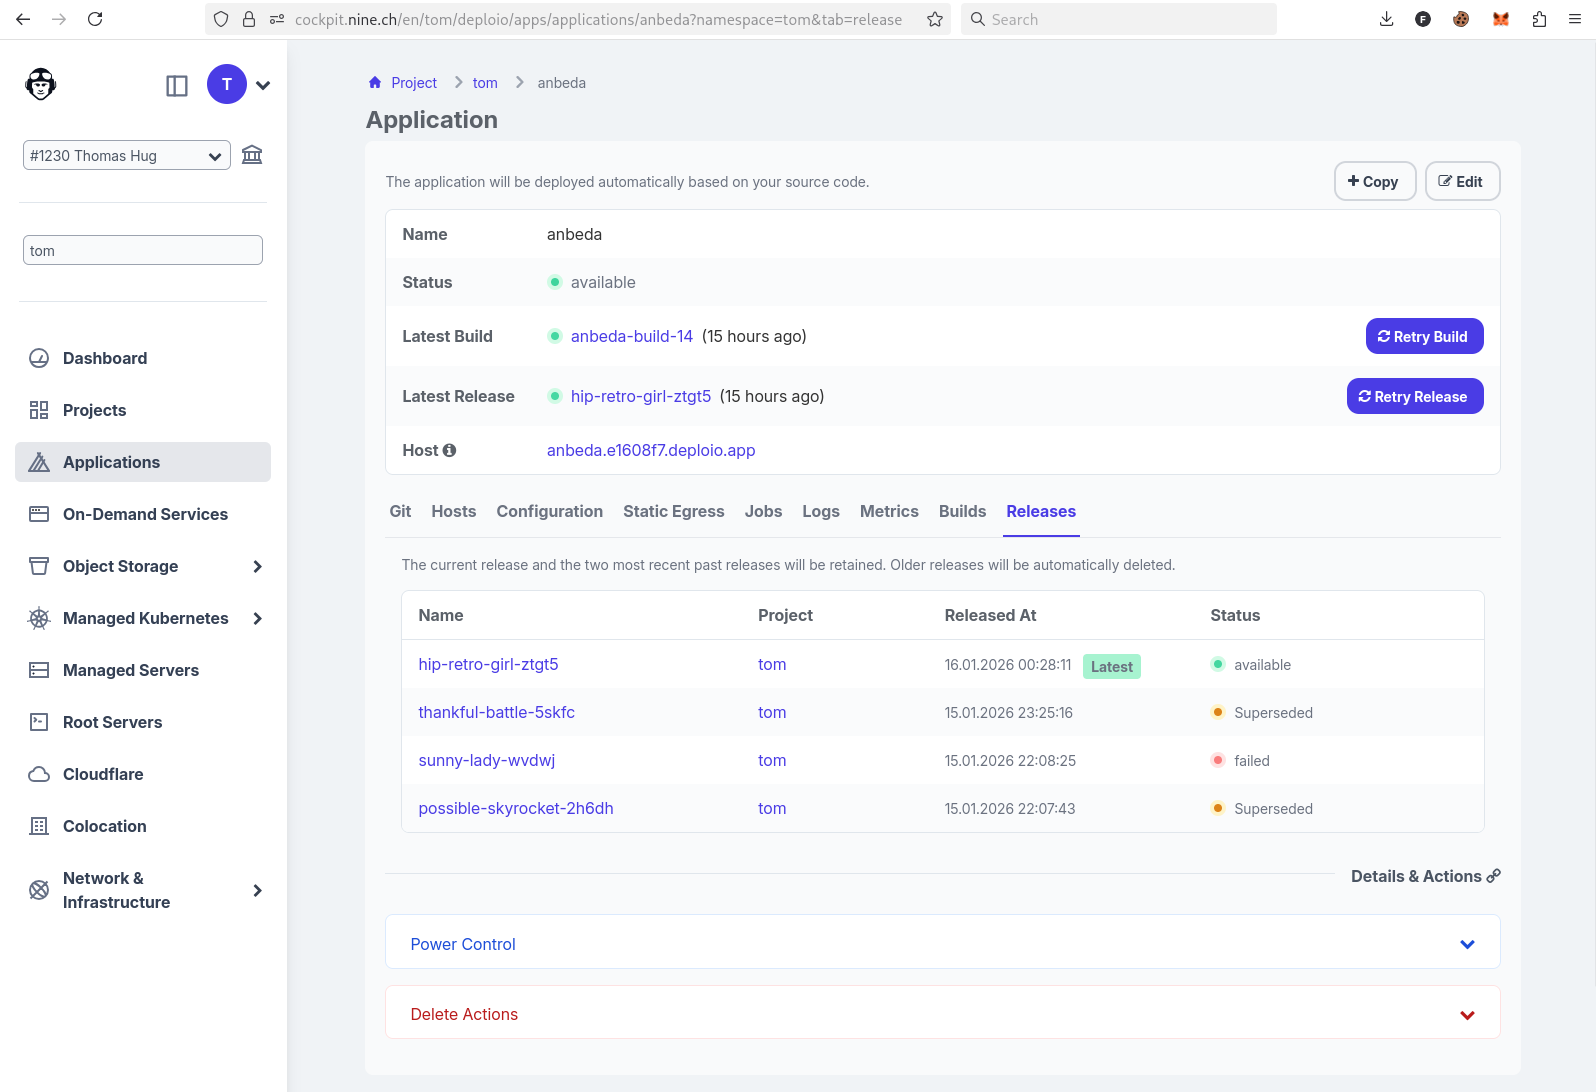
Add a Grafana instance: as soon as your organisation has a Deploio app, we install a Deploio dashboard with CPU and memory usage, replicas, restarts and HTTP requests. See observing your app.

Components

What each component does

Every component is optional, added in Cockpit and billed per instance. Many teams start with the Metrics Agent and Grafana, and add Alertmanager once they need notifications.

What it does
Metrics AgentCollects metrics and sends them to an external Metrics Cluster. Based on Victoria Metrics, configured with ServiceMonitor, PodMonitor and PrometheusRule resources. Runs on control plane nodes in the nine-system namespace, so your node pools stay fully available for applications.
GrafanaDashboards for your metrics, logs and traces. Comes with a default dashboard for your cluster, and a Deploio dashboard if you run Deploio apps. Log in with your Cockpit account.
AlertmanagerTurns alerts into notifications and routes them to Slack, email, PagerDuty or other channels, based on your configuration.
LokiCollects and stores the logs of your applications, explored in Grafana. Logs are shipped via a Promtail instance on your cluster and kept for 30 days by default, configurable.
TempoDistributed tracing, explored in Grafana together with your logs.
PrometheusThe predecessor of the Metrics Agent, still available for existing instances. For new setups, use the Metrics Agent.

Details in our documentation.

Pricing

What does Monitoring cost?

Grafana, per instance CHF 8.–
Alertmanager, per instance CHF 8.–
Loki, per instance CHF 14.–
Tempo, per instance CHF 14.–

All prices per month. Metrics beyond the 30,000 included cost CHF 0.003 per metric. The resources Grafana, Alertmanager, Loki and Tempo use are billed additionally. Promtail, which ships your logs to Loki, is billed as a separate instance. Prometheus (for existing instances) costs CHF 14.– per instance. Full price overview in the Price Calculator.

FAQ

Frequently asked questions

Is monitoring included without these services?
Yes, for the infrastructure: we monitor your Managed Kubernetes cluster and your Managed Server around the clock. The services on this page are for your applications: metrics, dashboards, alerts, logs and traces that you configure yourself.
Do I need all components?
No. Each component is optional and billed separately. The Metrics Agent collects metrics, Grafana shows them, and Alertmanager sends notifications. Loki and Tempo add logs and traces.
How is the Metrics Agent priced?
Per instance per month, including 30,000 metrics. Additional metrics are billed separately. If your usage is high, it’s worth checking whether you need all collected metrics. We help you reduce them.
Is there a limit on how much data I can collect?
There is a fair-use limit on unique time series to protect the shared metrics platform. If you need more, talk to us.
Can I configure my own alert routing?
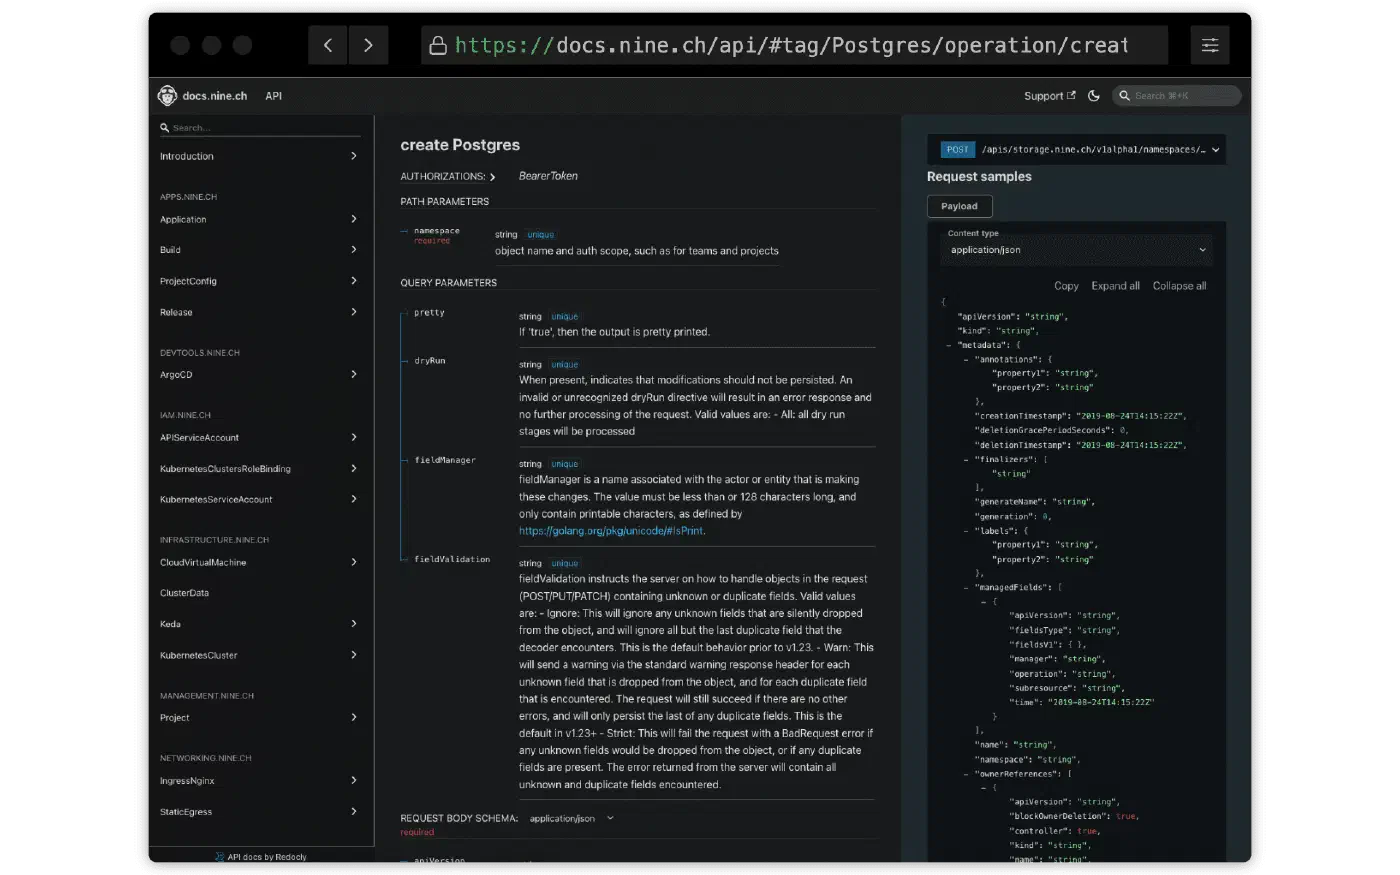
Yes. You set your own Alertmanager configuration (receivers, routes) on the instance yourself through our API, inline or from a secret in your project. Examples in the documentation.
Can I set up alerts in Grafana?
Grafana Alerting isn’t supported together with the Metrics Agent. Use Alertmanager for notifications instead.
What are the limits of the managed Grafana?
You can’t add your own data sources, and the pre-deployed dashboards can’t be edited. You can copy their panels into your own dashboards. Some of these restrictions can be removed by enabling admin access.

Technical details in our documentation.

One provider

One provider, from rack to app.

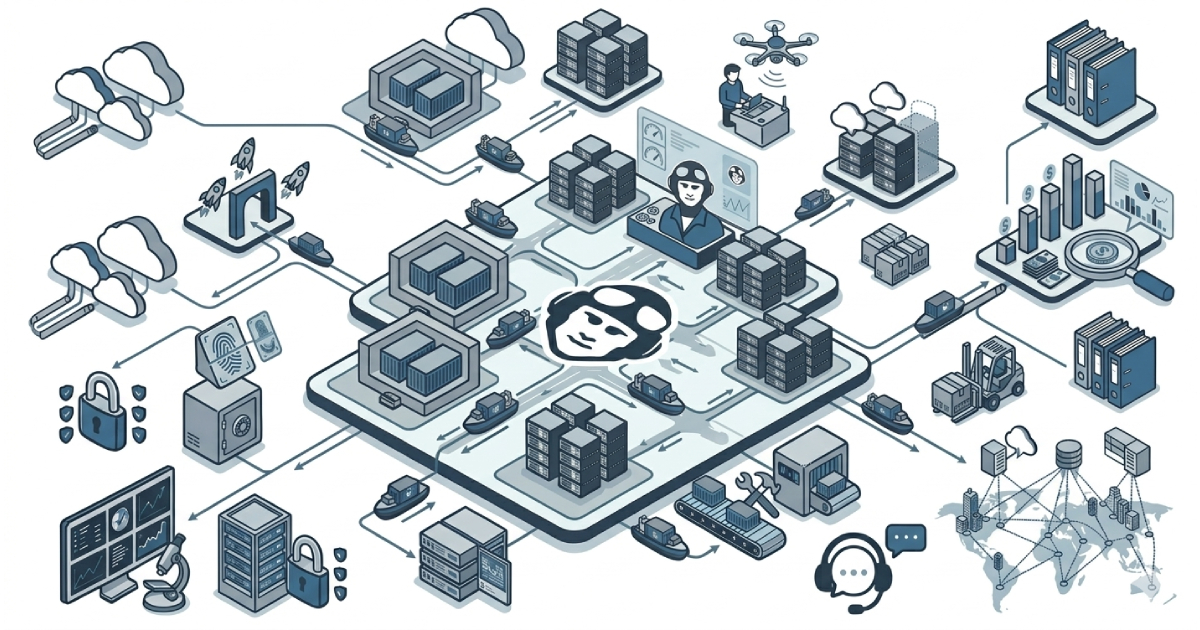
From colocation to Root and Managed Products, platforms and services: all with us, in our Swiss data centres. Grow from one layer to the next without switching providers. The highlighted layer is this page.

One Swiss teamGrow without switching providers

Need help setting up monitoring for your cluster?

We help you choose the right components and get started.

Talk to Our Experts

Do you have questions about our products? No problem. Contact our sales department or go directly to your Cockpit to see all the possibilities at Nine.

Subscribe to Our Newsletter for the Latest Updates: