 Status
















































































Monitoring is a critical part of any cloud-native application. As Kubernetes environments grow, so does the complexity and resource cost of observing them. Today, we are excited to announce the general availability of Metrics Agent for the Nine Kubernetes Engine (NKE).
This release marks a significant step forward in our “Global Metrics” initiative, designed to provide a centralized, efficient, and scalable observability platform for all Nine products.
The Challenge with Prometheus
Monitoring in NKE involved running a full Prometheus instance within each cluster. While effective, this approach has downsides:
- Resource Consumption: Prometheus can be memory and CPU intensive, eating into the resources available for your actual applications.
- Storage Complexity: Managing long-term persistent storage for metrics within the cluster is challenging and can be costly.
- Fragmentation: Metrics are locked inside each cluster, making it hard to get a unified view of your infrastructure.
Because of these reasons, Metrics Agent will eventually replace the standalone Prometheus product for NKE customers, providing a more efficient and centralized solution.
Enter the Metrics Agent
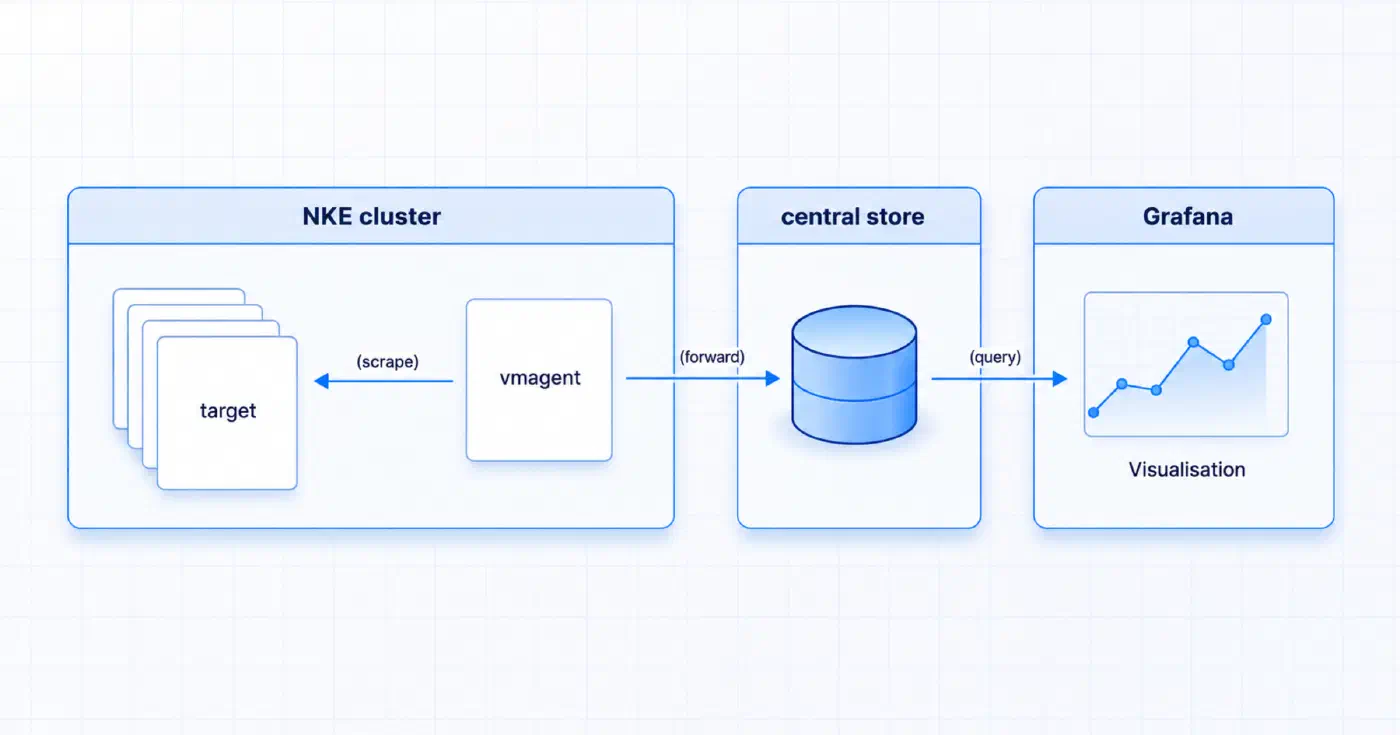
Metrics Agent is a lightweight component based on VictoriaMetrics. Instead of storing metrics locally, it collects them and pushes them to our centralized Global Metrics cluster.
This architecture brings several immediate benefits:
- Reduced Footprint: The agent runs on the NKE control plane, freeing up your worker nodes for your workloads.
- Centralized Storage: Your metrics are stored securely in our managed Global Metrics backend, ensuring durability and high availability without you needing to manage Persistent Volumes for monitoring.
- Standard Configuration: We leverage the popular Prometheus Operator ecosystem. You can continue to define your scraping targets using standard
ServiceMonitorandPodMonitorresources.
Important: Metrics Agent is currently limited to 100,000 unique time series per day. See the documentation for details.
How It Works
When you enable Metrics Agent on your NKE cluster, it deploys a vmagent (VictoriaMetrics Agent) into the nine-system namespace. This agent automatically discovers targets based on your configuration.
To start scraping an application, you simply create a ServiceMonitor or PodMonitor and add the required label:
labels:
  prometheus.nine.ch/<your-agent-name>: scrape
Note: Replace <your-agent-name> with the specific name of your metrics agent.
The agent then scrapes the targets and forwards the data to our central store, where it becomes available for querying via Grafana.
Note: Metrics Agent does not currently support Grafana Alerting. Use Alertmanager instead for alerting rules.
Pricing
Metrics Agent billing is based on your actual usage, plus a fixed fee per instance. For current pricing details, see the Metrics Agent documentation.
Migrating from Prometheus
If you’re currently using Prometheus in your NKE cluster, migrating to Metrics Agent is straightforward. By naming your Metrics Agent the same as your existing Prometheus instance, it will automatically pick up all your existing ServiceMonitors and PodMonitors without any configuration changes.
For detailed migration steps, see the migration guide in our documentation.
Getting Started
Metrics Agent is available now for NKE. To get started, read the full Metrics Agent guide for detailed setup instructions.
One Platform for All Metrics
The release of Metrics Agent is part of our broader vision for a unified observability platform. We are actively working on adding metrics from more of our managed services to this global storage, giving you a single pane of glass for your entire infrastructure at Nine.
Users of our PaaS product, Deploio, benefit from a similar observability experience: application metrics there can also be visualized via your own Grafana instance. You can learn more about this in the Deploio observability documentation.
We believe this new approach will significantly simplify how you monitor your applications on NKE. Activate Metrics Agent directly in Cockpit or follow the migration guide to switch from Prometheus. As always, we are here to help - if you have questions or need assistance, please reach out to our support team.
